


For the first time since the fall, sales saw a year-over-year increase. Despite this, inventory remains elevated, with 6,008 new listings entering the market. Homes are currently spending an average of 35 days on the market.
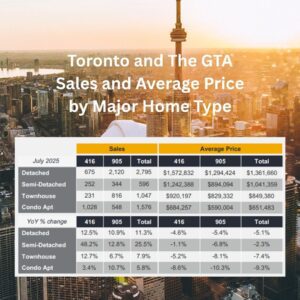
Below, you’ll find the average sold prices across different housing categories, along with year-over-year (YoY) comparisons for both prices and sales:
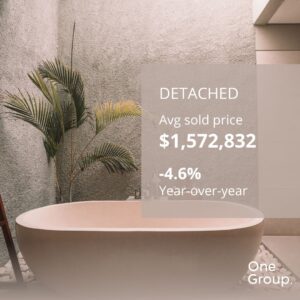
👉 The average sold price for detached homes dipped to $1,572,832, marking a 4.6% decrease compared to the same time last year. Despite the price decline, sales activity has picked up, with a 12.5% year-over-year increase.
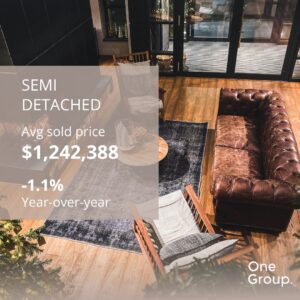
👉 Semi-detached properties sold for an average of $1,242,388, showing the smallest year-over-year price decline at just -1.1%. This category also saw the strongest rebound in buyer activity, with a remarkable 48.2% increase in sales compared to last year.
👉 Townhomes sold for an average of $920,197, reflecting a 5.2% year-over-year decrease in price. Still, buyer interest remained strong, with sales rising by 12.7% compared to the same period last year.
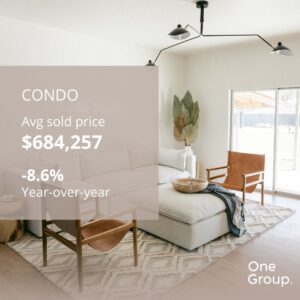
👉 Condo sales posted their first year-over-year increase of 2025, up 3.4% — a modest but meaningful shift in momentum. However, prices remain under pressure, with the average sold price at $684,257, representing an 8.6% decline from the same time last year.
Looking at the numbers, two parallel trends emerge. Sales are rising across all housing types, even amidst tightening market conditions and ongoing trade uncertainties. Conversely, average prices are still down across the board.
But there’s a silver lining: increased buyer confidence and higher inventory levels are helping improve affordability — something that’s been missing in recent years. While this may not mark the dramatic turnaround some were hoping for, it’s a notable step up from the steady decline we saw in the first half of the year.
Buyer and seller alike may benefit from professional help. If you have questions or need assistance, send us a message. We are always happy to discuss.