


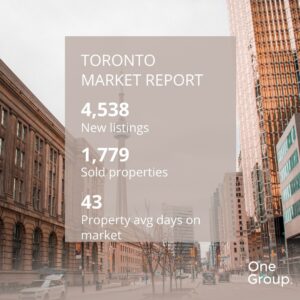
The August numbers are in, and they paint a clear picture of the market. Inventory remains high with 4,538 new listings and more than 9,600 homes available for sale. Properties are taking longer to move, averaging 43 days on the market. While average sale prices have edged down, activity levels were stronger this summer compared to last year.
Below, you’ll find the average sold prices across different housing categories, along with year-over-year (YoY) comparisons for both prices and sales:
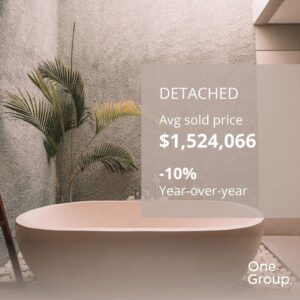
👉 The average detached price came in at $1,524,066, down 10% compared to the same period last year. Despite the price decline or more likely because of it, sales activity continues its momentum with a 10.5% year-over-year increase.
👉 Semi-detached properties experienced the strongest surge in interest with sales jumping 18% even though the average price slipped 6.1% to $1,131,498.

👉 Townhomes also gained traction with sales up 9.4% and the average price of $915,511 up by 1%. This is the only housing segment posting a price growth this month.

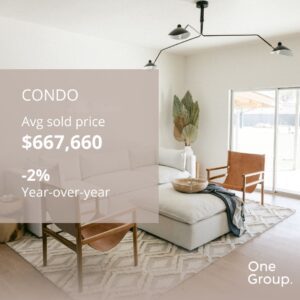
👉 Condo activity painted a different picture. The average price eased by 2% to $667,660 and failed to continue the previous month’s surge in sales activity with a 3.4% dip.
Current conditions reveal a distinct divergence between freeholds and condominiums. Freeholds are becoming increasingly attainable for move-up buyers, while condos continue to exhibit relative weakness. For buyers, this environment presents opportunities across both property types. For sellers, it reinforces the need for precise pricing strategies and strong market positioning.
Despite prevailing economic uncertainties, buyer engagement has held steady. Elevated inventory levels are already exerting downward pressure on prices; however, a meaningful acceleration in sales activity will depend on further improvements in borrowing affordability.
Buyer and seller alike may benefit from professional help. If you have questions or need assistance, send us a message. We are always happy to discuss.