Last month we saw 7,481 new listings hit the market with an average sold price of $1,088,021. That’s a remarkable 20.3% year-over-year change, a jump from 9.6% in March. The overall average Days On Market is down to just 11 days compared to 17 days previously.
Let’s walk you through the numbers, from the biggest jumps to the lowest.
First on the list are townhomes. We saw the biggest growth of 27.7% YOY. A staggering spike with an average sold price of $1,216,657. Townhomes were just selling a little over $950,000 in April 2020
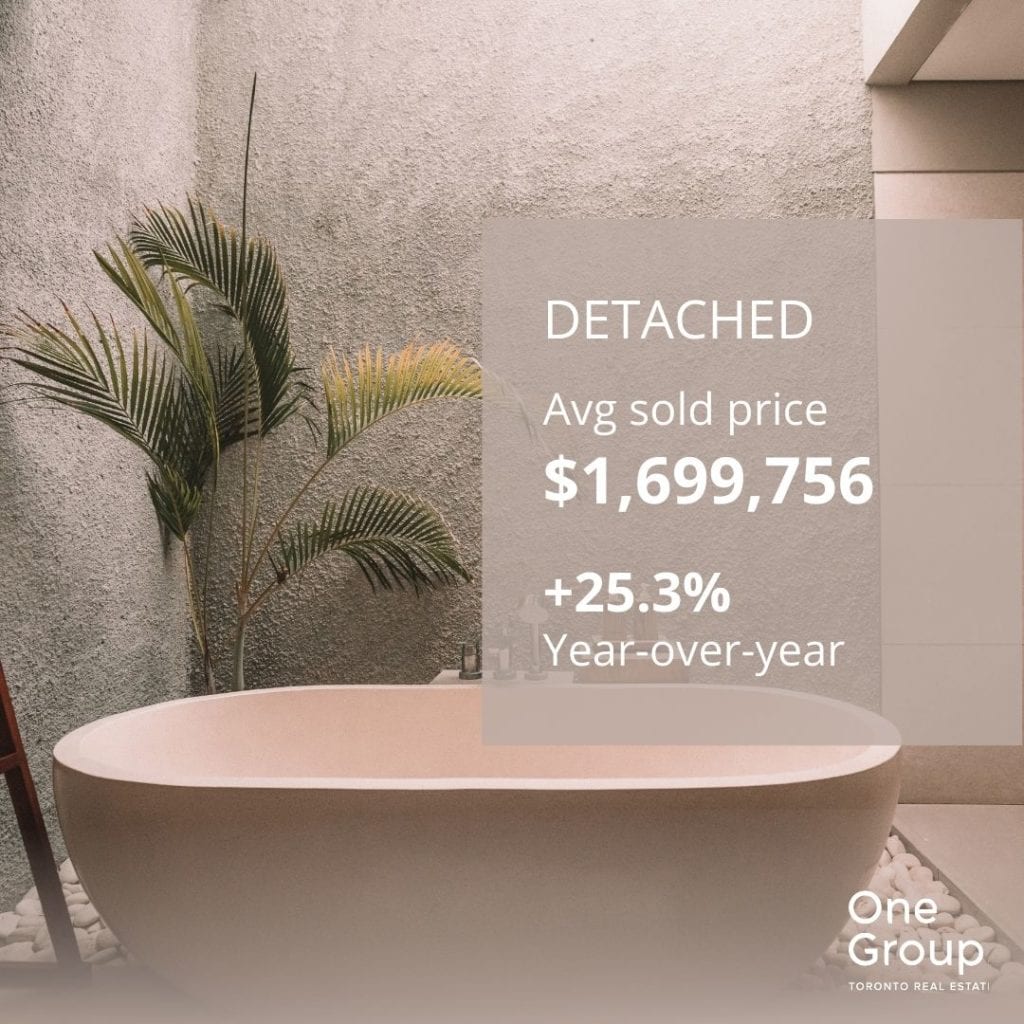
Next, we have the much-coveted detached homes. We had good growth of 25.3% YOY with an average sold price of $1,699,756. Interestingly, we were at 19.4% YOY in March and though we are now higher YOY, the average price is slightly down from $1,750,518.
The average sold price for semis has also increased to $1,308,799, a big jump of 24.4% year-over-year growth. Compared to 11.4% YOY in March.
Lastly, we have condominiums. The average sales price finally increased to 14.1% YOY compared to last month which was at -0.6%. The average sold price went up to $727,137 from $707,835 compared to last month.
Big numbers across the board. Will be interesting to see May stats, with the lockdown and some buyer fatigue setting in.
Don’t hesitate to reach out to understand the market on a micro level in your specific building or neighborhood. Fill out the form below and we will definitely get back to you.